|
Data Input There are seven types of input field, most of them quite straightforward: 1. The share name: to identify the share 2. The share price and dividend table. The format and input method is described below. 3. The share data sample interval, expressed in number of days, used in the annualisation of the returns. 4. Economic condition fields: these specify the data points that the economic conditions span from and to. Their use is described in the Quick Start guide. 5. Economic condition probability ratios: these ratios are initially set to the ratios of the condition time-spans and should be updated to reflect the actual condition probabilites. 6. Annualised returns: these are calculated automatically but values may be input directly. 7. The risk-free rate: used in the identification of the super-efficient portfolio. Share Price & Dividend Table – Format and Input |
|||
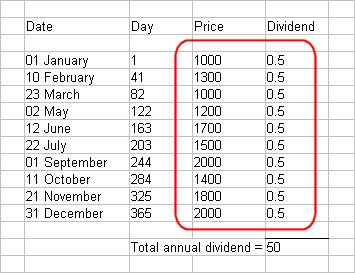
| The table consists of pairs of price and dividend values. The price values describe the price changes over time and the dividend value holds the portion of the dividend yield for each time-step. For example, in the simplified case of a share described by 10 data points (or data pairs) over a year, the table might be prepared like so: |
|
||
|
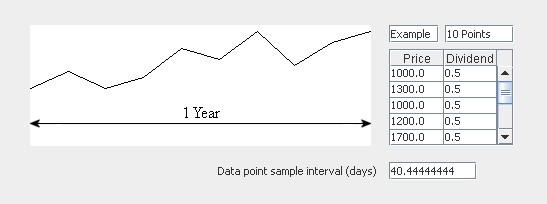
Such a table would appear in the applet like this: |
|||
|
|||
|
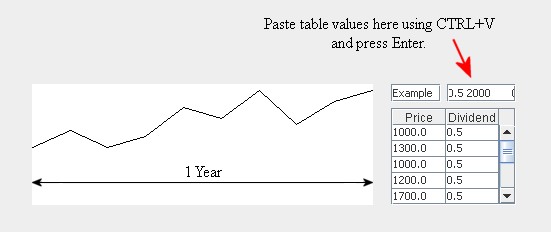
Table values should be pasted into the applet via the table entry field using CTRL+V. |
|||
|
|||
|
The table entry field will report how many data points (pairs) were entered and whether there were any errors encountered, such as text or leading spaces. Table values can be copied from the applet using CTRL+C. |
|||