|
Quick Start Guide Sample data has been pre-loaded to facilitate a quick start with the applet. The only further input required to run an analysis is the specification of the economic conditions: |
|||
|
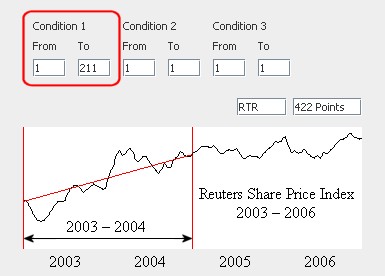
The share price sample data consists of four years of price data: 2003 – 2006, represented by 422 data points for each share. (This is an arbitrary representation and may vary according to data available, e.g. daily prices or weekly prices.)
An economic condition time-period is specified by reference to the data points, e.g. point 1 to point 211 represents the time-period from the beginning of 2003 to the end of 2004. |
|
||
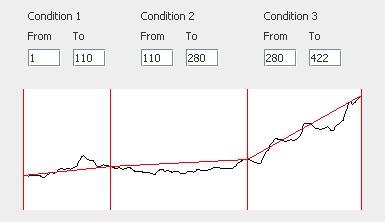
| Thus, three economic condition time-periods can be specified: |
|
||
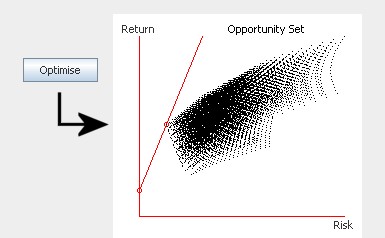
| It merely remains to click the 'Optimise' button to calculate the super-efficient portfolio: |
|
||